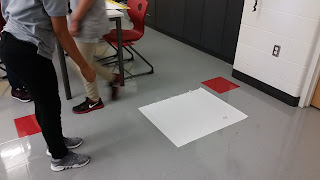
I wanted to create some sort of mildly competitive a game that would convey the idea that standard deviation (or any measure of spread) does not depend on how high or low the average of a data set is, but on how much all of the data points vary from that average. Unfortunately, the objective of most games is to either get a high score (e.g. cup stacking challenge), or meet some other specific criteria (e.g. landing on red in roulette).
It turns out that boccie is one of the few games where the winner is not the person that throws toss their ball the farthest, but the person that can toss their ball closest to a designated ball, regardless of how close or far away it is. The real rules can be found here, but we needed to make a few modifications to make it work for us. There was no pallino, and the score wasn't calculated by counting how many balls were closest to the pallino. Here are some instructions:
(1) Put some sort of lines on the floor so students will be able to tell how far they've tossed the balls from where they are standing. I used chart paper, but you could easily just lay a measuring tape on the floor, or count floor tiles.
(2) Place the class into pairs - these pairs will be competing against each other. Each pair should take turns rolling 5 crumpled balls of paper onto the floor (we used ping pong balls originally, but they rolled too much). It helps if the two partners have two different colored balls.
(3) The objective is to get your balls as close as possible to each other, while making your opponent's balls more spread out. You are allowed to knock your opponent's balls away from the group as you toss.
(4) Once all 10 balls have been tossed, ask students to record the distance of their five balls from where they stood. If there is time, groups can play a second or third game.
(5) Once everyone in the class had played at least one game, ask students to find the standard deviation, range, and IQR of their 5 balls from one of their games.
I asked students to determine which partner won, and why. This led to a really great discussion of how we calculate all three measures of spread, what the advantages and disadvantages of each measure is, and which measure was appropriate for this game. We didn't have enough time to delve too far into a discussion, but I could see this turning into a 5-practice routine where groups need to defend which measure of spread would be best for this game. I also think this is a great way to visually see the differences between standard deviation, range, and IQR for students that have trouble calculating each.
Who wins this game?


No comments:
Post a Comment