Monday, April 23, 2018

Norming our Personal Philosophies of Grading

Standards based grading is all about assessing what we value. Whether you are doing this by yourself or with a team of teachers, it's important to have a personal philosophy of grading. Since every classroom is different, you'll need to adapt your standards based method to meet the needs of your students. A philosophy can help you do that. A philosophy can also give you something to fall back on when you're challenged by a student or parent.

So, here are three activities that tend to help:

1. What does it mean for a student to pass your class?

In some places, passing is a 60. In others, it’s a 70. Think about what it means for a student to barely pass your class for the year. Then, think about what it should mean for your student to pass for the year.


2. What is the purpose of a final grade in your class? A card sort.

Below are a list of purposes a final grade might have. Number the following purposes from most important to least important. Alternatively, you might just circle the top three purposes. Note that this activity is best done as a card-sort with slips of paper.
  • Feedback About Achievement for the Student
  • Feedback About Achievement for the Parent
  • Feedback About Effort & Behavior for the Student
  • Feedback About Effort & Behavior for the Parent
  • Informing Daily Instructional Planning
  • Informing Long-Term Unit Planning
  • Informing Intervention or Support Teachers
  • A Motivation Tool for Students
  • A Prerequisite to Pass to the Next Level Class
  • A Factor in Entrance into College
  • To contribute to their GPA and Class Ranking


Once you rank, think about the following questions:

  1. What were your top three purposes? Why?
  2. What were your bottom three purposes? Why?
  3. How could we change the way we assess to target the most important purposes?
  4. Are there any purposes that might be inappropriate to include in a final grade, but that are still important? How can we incorporate those into our classroom practice?

3. What’s in a grade? Assessing what we value with colored manipulatives.

Since standards based grading is all about assessing what we value, let’s norm our grading system. I have created four large categories that most graded assignments in our class can fit into with descriptions below. In a true standards based system, we standards would be reported separately. Unfortunately, many schools still use a traditional model that requires us to give each student one final grade at the end of each marking period.  


Typically, this activity would be completed with a pile of red, blue, green, and yellow chips that correspond to the categories. Each of chip represents 10% of your ideal total grade makeup for your class. Your job is to take 10 chips that best represent how you would create your final grade. If you're on paper, just shade in 10 squares.


Content Grades: Blue Chips

This grade represents a student’s progress towards mastery of content standards. This could also be called the “traditional” math grade. Typically, these skills are not very transferable. 

☐   ☐   ☐   ☐   ☐   ☐   ☐   ☐   ☐   ☐

Practice Grades: Red Chips

This grade represents a student's progress towards the math practice standards. These could be seen as an “application” grade. Typically, these skills are transferable to other fields.

☐   ☐   ☐   ☐   ☐   ☐   ☐   ☐   ☐   ☐

Scholarship Grades: Green Chips

This grade represents a student’s progress towards the transferable qualities of being a “productive student”. Typically, these skills are transferable to all other academic settings.

☐   ☐   ☐   ☐   ☐   ☐   ☐   ☐   ☐   ☐

Completion Grades: Yellow Chips

This grade represents the completion of a specific task. Often an “all or nothing” grade to elicit a behavior.

☐   ☐   ☐   ☐   ☐   ☐   ☐   ☐   ☐   ☐

Once you are finished, turn and talk to your partner about the following questions:
  1. What categories have the most or least number of chips? Why?
  2. Does our ideal system match our current system? What would we need to change?
  3. Does your grading system reflect your classroom practice? In other words, if you allocated 50% of your grade to practice standards, does 50% of your classroom practice include the mathematical practices?
  4. Are there any aspects that would be inappropriate to grade, but that are still important? How can we incorporate those into our classroom practice?

Sunday, April 22, 2018

Building a Flexible Standards-Based Classroom within a Traditional School Setting

Hi, I’m Bob. I’ve been using standards-based grading (SBG) within a traditional grading setting for five years. I’ve done it at two schools, in two different environments. I’ve also worked with a grade-level team to make the transition. However, in every environment I've been in, I'm either the only or one of the only teachers to use SBG. As a result, I've had to bend some of the "rules" of SBG. I like this quote from Frank Noschese:

A traditional system done in the spirit of SBG is much, much better than an SBG system done poorly.

There are some great resources for making a whole school shift to standards based, but this is not one of them. These resources are aimed at teachers who want the benefits of standards based grading, but who work within a traditional grading system.

What do I mean by a traditional school? I mean a school where...

...grading software allows for points, or maybe category weights. No standards.
...assessments are named in general topics like “Quadratics”, points are assigned to each question, and the student gets one score on the top
...most assignments are viewed out of 100% and students rush to a calculator to find out that 5/7 is a 71%
...the end of the year grade is either out of 100, or A/B/C/D/F, and a GPA is used
...classes are tracked, and perhaps GPA is based on those tracks (e.g. honors students can get a higher GPA)
...it is encouraged that certain behaviors (e.g. homework completion, participation) are scored by completion
...there is no scholarship or participation grade separate from the letter grade
...most stakeholders want to see lots of grades in the grade book and don’t want you waiting for a summative to put in a grade
...textbooks and worksheets are used often

So, how do I work around these constraints? Click below to find out!

Norm your personal philosophy of grading

Think about three types of standards

Focus on assessing concepts with content standards

Push students to work like mathematicians with practice standards

Encourage academic habits and reflection with scholarship standards

Give students multiple opportunities to practice

Encourage and facilitate growth

I also have some slides that I use when I present. Find those by clicking below:

2017 - 2018 Slides

I begged, borrowed, and stole from a number of great people. Click below to read blog posts and articles from a number of talented and thoughtful people!

Frank Noschese
Matt Townsley
Dane Ehlert
Dan Meyer
John Stevens
Sam Shah
Matt Vaudrey
Dylan Kayne
Daniel Schneider
Bruce Jackson
Anna Blinstein
Marissa Walczak

Saturday, November 25, 2017

An Autopsy of a Sophomore Statistics Unit

This year, we flipped our sophomore geometry class around. Typically, we end the year with a statistics and probability unit, but this year we started with it. In fact, we extended the units from the end of August all the way until Thanksgiving break. Our beefed up units included:
  • Creating data displays
  • Probability using Venn Diagrams and two way tables to find unions, intersections, and conditionals
  • One variable measures of center, spread, and shape
  • Measures of location (z-scores and percentiles)
  • Experimental design and survey methods

There were many reasons we made the change, but here are a few:

  • Connecticut is using the SAT as its high school accountability test, and it has a fair amount of statistics on it (and very little geometry)
  • Statistics has been the last unit in our districts 6-8 curriculum, and we all know what happens to units at the end of the year...
  • We used to have 1-var stats and linear regression in algebra I, probability in geometry, and polynomial regression in algebra II, but teaching everything separately felt very disjointed.
  • Our department generally agreed with Arthur Benjamin's ideas about teaching statistics.

Now for the autopsy (complete with emojis)...

😒 It was a struggle for our geometry teachers to change gears at the start of the year. We found that many of the routines that work in geometry don't work as well with statistics. I have typically used a Which One Doesn't Belong to start every geometry class, but I found it very difficult to find or make ones that worked in statistics. Over time, I found that other routines such as Would you RatherClothesline Math, and some 3-act tasks were better suited to starting a lesson.

😩 The shift in content was also tough for teachers. At our school, statistics is typically offered as a senior year course, and our 9th and 10th grade teachers hadn't seen some of the content in years. Remembering how to calculate z-score took a minute; remembering how to teach the meaning behind it took longer. Shout out to the teachers who provided resources that made it so much easier:


😁 On the other hand, students felt much more at ease as compared to previous years. We have previously started the year with coordinate geometry, which relies heavily on skills from algebra I.  I've started the year with Jo Boaler's Week of Inspirational Math for the past three years, but students that didn't fare well last year see the writing on the wall and begin to withdraw early. Starting with statistics circumvented that issue and promoted more of a growth mindset.

😃 Starting with statistics also felt natural, because at the start of the school year you're trying to learn more about your students. Those student surveys and "getting to know you" activities suddenly had more of a purpose. It felt natural to ask students what town they lived in (we're a magnet), then ask how long they rode the bus to get to school, then make a histogram of those times, and finally look at the center and spread of the data.

😏 Staying with statistics for an extended period of time let us talk about social justice issues. For example, after looking at the bus ride data we were able to have an informed discussion about the impact of magnet school busing on our students. Unfortunately, these conversations tended to be limited to one lesson. I would love to have students explore social justice issues further, but I'm not quite sure how I would go about it, if my sophomores are ready for that, or if there is enough time.

😓 Speaking of not enough time, we're now in a situation where our normal geometry curriculum is compressed by six weeks. Since the SATs don't focus on geometry, most higher-ups doesn't see an issue. However, I know that our team of geometry teachers will need to start picking and choosing what topics in geometry we can spend less time on. Wish me luck!

The conclusion: the stats unit will live to see another year!

Saturday, October 14, 2017

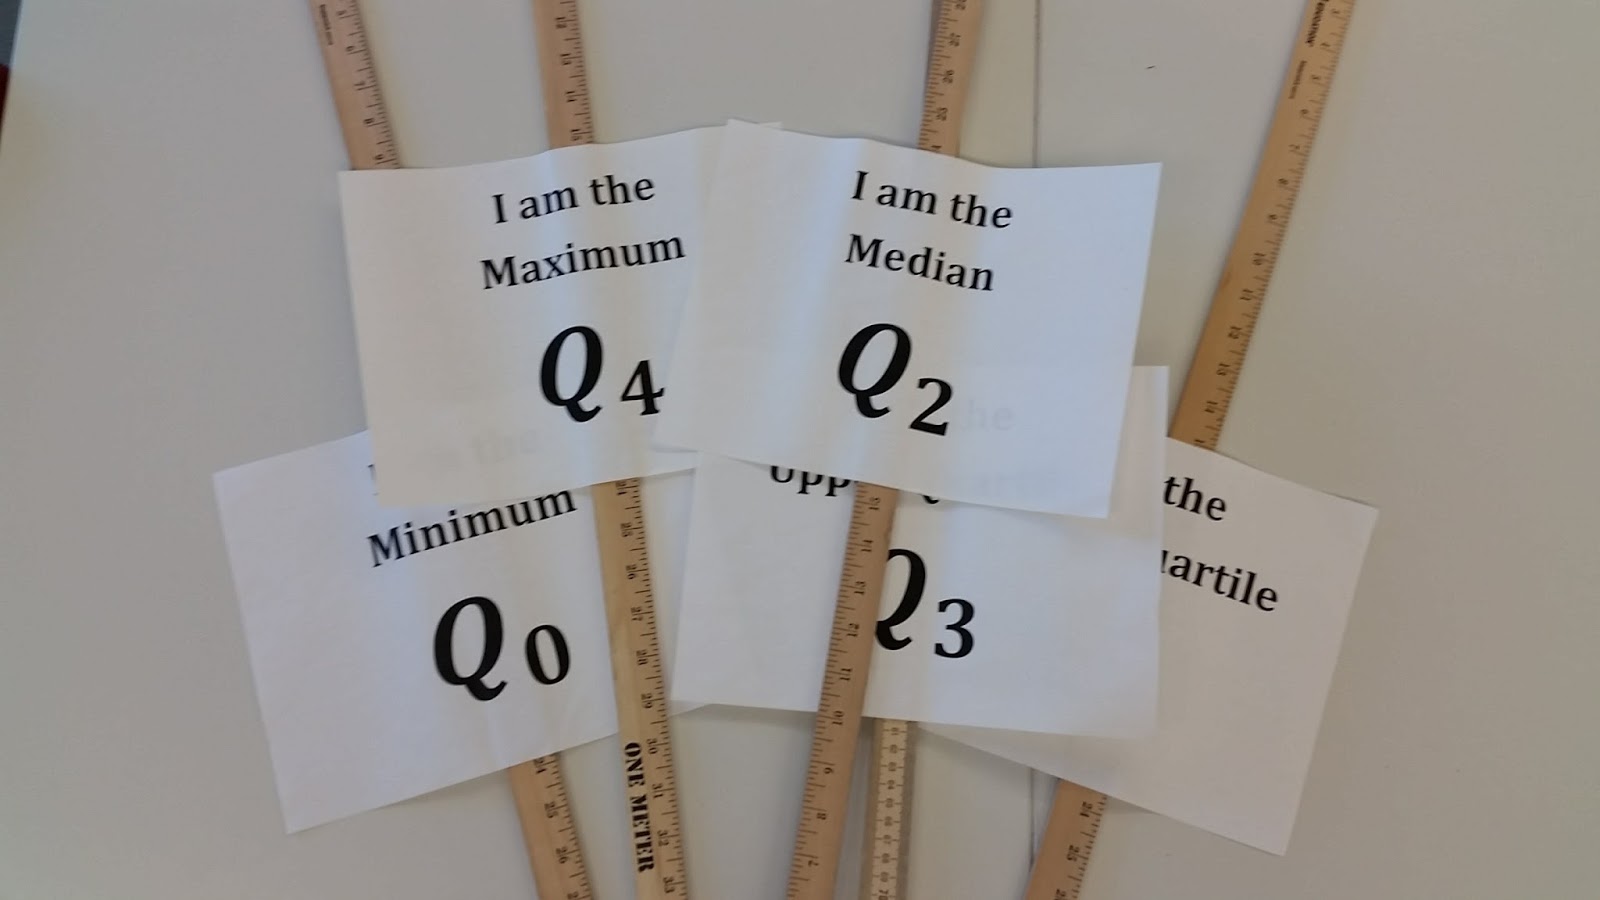
Human Box Plots

Class walks in.

"Hey everyone. I put some marks on the floor. Try to stand in the right spot according to your height."


"Oh yeah, I made these too. Figure out who should hold these. I'll just wait over here."


"Can we make it look a little more 'box-plotty'? Yeah, like that. Smile!"

Someone moved just before the picture. 
Can you find the error?

Besides this being a goofy team building activity, it provided a good reference point for students to understand how boxplots work: There should be (roughly) the same number of people in each quartile. Small quartiles don't mean there are less people with that height; it means that the same number of people are crammed into a smaller range. You can see the girls peeking through in the middle. Big quartiles don't mean there are more people with that height; it means that there are the same number of people spread out in a bigger range. Just look how much space the girl in red off to the right has! Every time a student had a misconception about box plots, I reminded them of this activity.

Saturday, September 30, 2017

Standard Deviation Boccie

I wanted to create some sort of mildly competitive a game that would convey the idea that standard deviation (or any measure of spread) does not depend on how high or low the average of a data set is, but on how much all of the data points vary from that average. Unfortunately, the objective of most games is to either get a high score (e.g. cup stacking challenge), or meet some other specific criteria (e.g. landing on red in roulette).

It turns out that boccie is one of the few games where the winner is not the person that throws toss their ball the farthest, but the person that can toss their ball closest to a designated ball, regardless of how close or far away it is. The real rules can be found here, but we needed to make a few modifications to make it work for us. There was no pallino, and the score wasn't calculated by counting how many balls were closest to the pallino. Here are some instructions:

(1) Put some sort of lines on the floor so students will be able to tell how far they've tossed the balls from where they are standing. I used chart paper, but you could easily just lay a measuring tape on the floor, or count floor tiles.


(2) Place the class into pairs - these pairs will be competing against each other. Each pair should take turns rolling 5 crumpled balls of paper onto the floor (we used ping pong balls originally, but they rolled too much). It helps if the two partners have two different colored balls.


(3) The objective is to get your balls as close as possible to each other, while making your opponent's balls more spread out. You are allowed to knock your opponent's balls away from the group as you toss.


(4) Once all 10 balls have been tossed, ask students to record the distance of their five balls from where they stood. If there is time, groups can play a second or third game.


(5) Once everyone in the class had played at least one game, ask students to find the standard deviation, range, and IQR of their 5 balls from one of their games. 

I asked students to determine which partner won, and why. This led to a really great discussion of how we calculate all three measures of spread, what the advantages and disadvantages of each measure is, and which measure was appropriate for this game. We didn't have enough time to delve too far into a discussion, but I could see this turning into a 5-practice routine where groups need to defend which measure of spread would be best for this game. I also think this is a great way to visually see the differences between standard deviation, range, and IQR for students that have trouble calculating each.

Who wins this game?

Saturday, September 16, 2017

Choose the Best Player: A 1-Variable Stats Anchor

I know that there are a lot of activities out there that you could use as an anchor for a 1-variable statistics unit, but they didn't quite fit my needs. So of course I made one...


I used this activity twice. I first gave it to students before we had started the unit on measures of center and spread. I told them that there were six high school seniors that had been identified by recruiters to play for the UCONN Basketball Team. Unfortunately, there were only scholarships for two players. They had to work with their group to pick the two players using the data I gave them, and create a poster defending their choice. We followed a 5-practice routine discussion structure, and I found that their responses gave me great insight into how to navigate the next two weeks of instruction.

I also gave this activity to students as an assessment when we were finishing up measures of center and spread. This time, I told them that none of the prospective players got recruited. They now had to play the role of angry parent and explain to me why their son should have made the team. I assigned each group a prospective player, read through the scoring rubric, and sent them on their way.

This time, I had the groups present out to the class. The class also had a chance to ask questions and respond. Here's the best line from that class:

Brendan is a great player, and you should choose him, because if you remove those two outliers his average increases. He just had a couple of bad days, and those days skew the data. 

What happened on those days?

His dog died. 

What about the other day?

His dog died... twice.


Friday, April 14, 2017

Five things I Learned About Growth Mindset & Student Engagement at NCSM/NCTM 2017

I was honored to receive one of NCTM's Future Leader grants to attend NCTM this year. I strongly recommend anyone who is interested to check out their list of grants and apply here. Below are five things I learned about growth mindset and student engagement.


1. Revisit Jo Boaler’s work: Of course, any discussion on growth mindset has to include Jo Boaler. At the start of the current school year, I had posted and discussed her growth mindset norms with my students and used her “Week of Inspirational Math” which can be found on youcubed.com. While many of my students showed initial change, they began to stall around November. At NCSM, I had the opportunity to talk with her in a small group about the issues surrounding a long-term shift to growth mindset (NCSM 2017, Session 1630). Below is some of the advice she gave me:
  • Review the growth mindset norms, and adjust them to fit your student’s needs. Don’t be afraid to deviate from the seven norms laid out in Mathematical Mindsets if they suit your students more.
  • Leave time to complete at least one low-floor high ceiling task per week, perhaps on each Friday.
  • Have students complete the free YouCubed online course.
  • Help other staff members develop their own growth mindsets and encourage them to promote a growth mindset in their classes. It can be difficult for students to get the message if you’re the only one promoting it in your school. A few ways to do this are to try low-floor high-ceiling tasks together during staff meetings, bring in student work from their own classroom tasks, or modify your lessons using the new growth mindset cards. More on this later.

2. Capitalize on social and emotional competencies embedded in the SMPs: Often, we believe that the sole purpose of the Standards for Mathematical Practice is to develop mathematical dispositions and habits. However, Aurelia Milam demonstrated that we can use the social and emotional competencies embedded within the SMPs to help our students improve their self-awareness, social awareness, decision-making, self-management, and relationship skills (NCSM 2017, Session 1720).


In her session, we received a copy of the SMPs and highlighted language that we thought demonstrated opportunities for social and emotional learning. Later, we learned that two groups (University of Texas at Austin, Charles A Dana Center and the Collaborative for Academic, Social and Emotional Learning) had collaborated to create a document that explicitly describes how to integrate social and emotional learning into the CCSS. The full document is worth a read: check it out here.


3. Push your students to “own” the mathematics: Glenn Waddell and Megan Schmidt led a session at NCTM focused on teaching statistics through a social justice lens; however, instead of asking teachers to bend their lesson structure to fit in contrived examples, they advocated for keeping the regular lesson structure and letting students investigate their own ideas about their community or educational system. The act of questioning and changing how our educational system can best offer education to all people is called Critical Lesson Theory. Waddell and Schmidt suggested starting the school year by asking groups of students to develop questions about their community or school they want to answer. Then, as the means to answer one of those questions appear in the curricula, the individual group with that question would collect data. Next, the entire class would analyze the necessary data using the tools they had learned. Once the curricula had been finished for the year and all groups had answered their questions, students would be directed to turn their research into action. One possible timeline is below:
  • September: Group A wants to know if food at a local grocery store is more expensive than food at a national chain. They write their idea as a research question.
  • October: The class studies sampling techniques, and group A is asked to collect data on prices at two different grocery stores. Other groups collect their own data.
  • December: The class studies boxplot design, and half of the class charts the data from group A. The other half of the class charts the data from group D because they also collected one-variable data.
  • February: The class studies two sample t-tests, and the entire class analyzes the data from group A. They determine that there is no statistical difference between prices at the two stores.
  • June: Group A writes a letter to the local grocery store outlining their findings and presents it to the owner of the store. Other groups complete their own projects.
Waddell and Schmidt mentioned that it can be difficult to thread projects throughout the course so learners are constantly using their own and each other’s questions to learn statistics. Below are some of their norms and suggestions:
  • Start early and acknowledge that some conversations might be difficult.  
  • Get your principal or administration on board by talking to them.
  • Understand that you won’t know what projects or ideas the learners will create.
  • Write each group’s research question, so dependent and independent variables are explicit and discussions focus on ideas and not semantics.
  • Disagreement is okay, but listening to and respecting one another is vital.
  • Give students time to absorb and think.  
  • Be sure to listen. It’s okay if we don’t have all of the answers. 


4. Follow Peg Smith’s steps for encouraging productive struggle: Although I have read and reread 5 Practices for Orchestrating Productive Mathematics Discussion by Peg Smith and Mary Kay Stein, it is always important to revisit the idea of productive struggle. In this session, Smith played two videos of student discourse and asked us to comment on the moves the teacher made to facilitate student learning (NCTM 2017, Session 574). Through this process, she developed a definition of productive struggle:

The struggle is productive if…
  • The intended goals and the cognitive demand of the task are maintained
  • Student’s thinking is supported by acknowledging effort and mathematical understanding
  • Students are able to move forward in the task through their own actions
Next, we discussed the four steps needed to facilitate productive struggle (Warshauer 2015):
  • Teachers ask questions that help students focus on their thinking and identify the source of their struggle, then encourage students to look at other ways to approach the problem.
  • Teachers encourage students to reflect on their work and support student struggle in their effort and not just in getting the correct answers. 
  • Teachers give time and help students manage their struggles through adversity and failure by not stepping in too soon or helping too much and thus take the intellectual work away from the students. 
  • Teachers acknowledge that struggle is an important part of learning and doing mathematics.
We ended the session by noting that without selecting the right task and pre-planning student questions, the whole idea of productive struggle falls apart. This is often a point of improvement for me. My classes are unleveled and include a wide variety of learners. As a result, the tasks I select and the questions I ask can fall miles above or insultingly below a student’s level of understanding. Perhaps by using more low-floor, high-ceiling tasks, I can plan a more appropriate range of questions for my next lesson.


5. Develop a flipped self-paced mastery approach that expires within two to three weeks: I like the idea of a self-paced mastery approach, but I dislike the idea of having all of my students working on completely different topics. Nor do I like the idea of putting my students on computerized software that would differentiate for me. Instead, I wish that I could have all my students focus on the same topic, but with different levels of depth, so that they could still communicate and collaborate with each other.

In their session titled Self-Paced Flipped Model: A Twist on Flipped Mastery, Kyle Wilhelm and Shelly Lindsey presented a framework for combining a flipped classroom model with mastery based learning. They suggest creating two to three week mini-units that include a summative assessment at the end. During the unit, students watch videos at home and spend half of their class time attempting formative assessments, reflecting, and completing independent practice. These assignments are presented in a playlist of increasing depth and complexity, and students are encouraged to get as far as they can within the playlist before the summative. The other half of class time is spent completing group tasks or in stations designed to target the Standards for Mathematical Practice in a way that independent work cannot. The key is to develop tasks or stations that are accessible by all students, no matter what part of the playlist they are on.

I like this method, but I have questions about the summative assessment at the end of each mini unit. Students that did not finish their playlist, or did not get to activities with sufficient depth, would probably not have all the skills to perform well on their assessment. Perhaps there is a way to use a scale or rubric to account for these students.


6. [EXTRA CREDIT] Ensure that every dose of aspirin has a headache: To be honest, it would probably be redundant and over simplistic to distill this session down into a snippet at the end of an exceptionally long blog post. So, I’ll just direct you do Dan Meyer’s post.